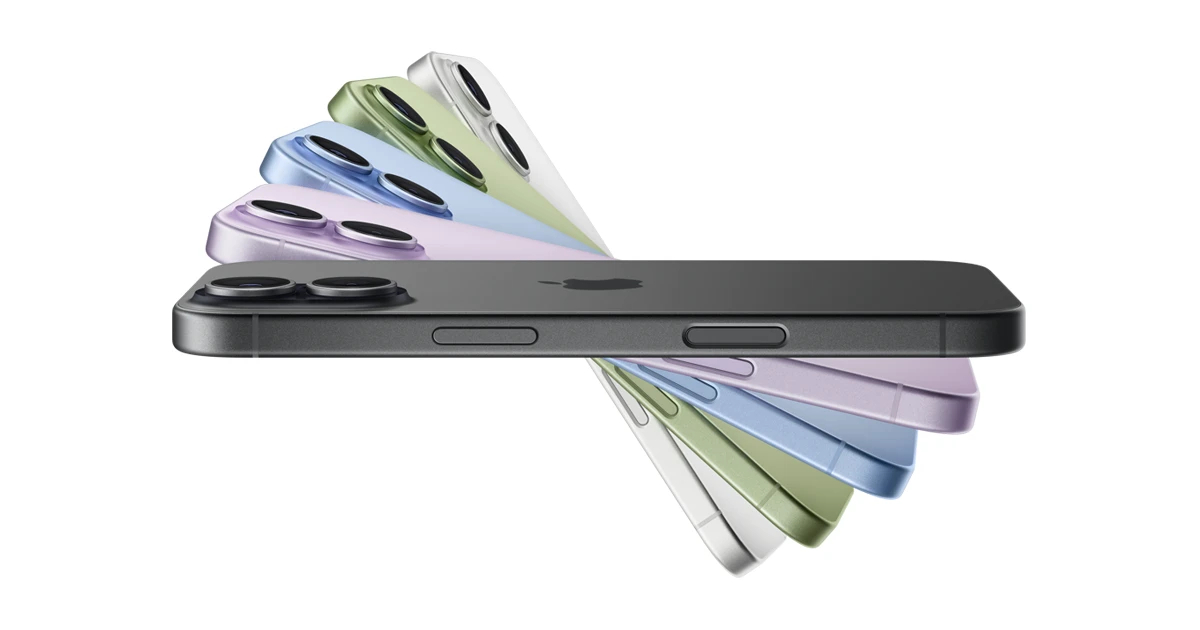
According to daily data for November 2–8, 2026, compiled in the “BCN Ranking,” which aggregates actual sales data from electronics retailers and online shops across Japan, Apple’s “iPhone 17” took the top spot in smartphone unit sales by series. It was followed by the “iPhone 17e” at No. 2, with Apple products sweeping the top three. Apple placed four models in the top 10, once again underscoring its strong presence in the Japanese market ahead of the year-end shopping season.
The ranking details are as follows.
| Rank | Model | Manufacturer |
|---|---|---|
| 1 | iPhone 17 | Apple |
| 2 | iPhone 17e | Apple |
| 3 | iPhone 18 Pro | Apple |
| 4 | Pixel 10a | |
| 5 | moto g06 | Motorola Mobility |
| 6 | Galaxy S26 | Samsung |
| 7 | arrows We3 | FCNT |
| 8 | iPhone 16 | Apple |
| 9 | Galaxy A25 5G | Samsung |
| 10 | A5 5G | OPPO |
Note: The BCN Ranking is a POS database that collects and aggregates actual sales data daily from major electronics retailers and online shops across Japan. It covers roughly 40% of the Japanese brick-and-mortar market (in the case of PCs).
Outside of Apple, Google’s “Pixel 10a” came in at No. 4, followed by Motorola Mobility’s “moto g06” at No. 5 and Samsung’s “Galaxy S26” at No. 6. The “arrows We3” from Japanese manufacturer FCNT broke into the No. 7 spot, while the previous-generation “iPhone 16” settled for No. 8. Samsung’s budget model “Galaxy A25 5G” took No. 9 and OPPO’s “A5 5G” took No. 10, with overseas manufacturers accounting for seven of the top 10 models.
Apple is making its mark not only in unit sales but also in battery performance. In a battery life test conducted by U.S. tech media outlet CNET covering 28 major smartphone models, Apple’s “iPhone 18 Pro Max” was selected as the overall leader. CNET ran two types of tests: one in which screen brightness was set to maximum and video was streamed over Wi-Fi for three hours, and a 45-minute test simulating typical usage such as video playback, video calls, gaming, and social media use. Both began from a full charge, and rankings were calculated based on the remaining battery level at the end.
In the 45-minute general usage test, the iPhone 18 Pro Max and the “iPhone Duo” consumed only 1% of their battery, earning the highest evaluation. Google’s “Pixel 11 Pro XL” also joined the third-place group with 3% consumption. In the three-hour video streaming test, the “iPhone 18 Pro” took first place with 6% consumption, followed by the iPhone 18 Pro Max, Motorola’s “Razer (2026),” OnePlus’s “15,” and others.
In the overall rankings, the iPhone 18 Pro Max took first place, with the iPhone 17, iPhone 18 Pro, Motorola Razer (2026), and OnePlus 15 tied for second. Third place went to Samsung’s “Galaxy Z Fold8,” fourth to the iPhone 17e, iPhone Duo, and Motorola Razer Ultra (2026), and fifth to the “Galaxy S26 Ultra” and “OnePlus 15R.” CNET analyzed that the iPhone 18 Pro Max benefited from a larger battery capacity than its predecessor, along with the power efficiency of the A20 Pro chip and optimizations in iOS 27.
On the other hand, some note that these test results do not necessarily mean battery performance has improved across the industry. CNET said the average battery performance of models tested in 2026 showed no major difference compared with products from 2025 and 2024, and noted that specs such as displays and processors also affect power consumption, so a larger capacity does not necessarily mean longer usage time between charges.
From a cost-performance standpoint, CNET gave high marks to the iPhone 17 and iPhone 17e. Outside of Apple products, Motorola’s $500 (about 80,000 yen) “Moto G Stylus” and $600 (about 96,000 yen) “Edge” made the overall top 10, demonstrating their presence.
While Apple dominates the upper ranks of Japanese actual sales, Google, Samsung, Motorola, OPPO, and others are clearly following in the mid-to-lower ranks. As competition among companies intensifies on both product strength—including battery performance—and price range, year-end shopping season trends appear likely to determine each manufacturer’s annual share.